Data Analysis - Reports
Return to Data Analysis
- 1. Navigation
- 2. Standard Reports
- 3. Request Review Reports
- 4. Support Rep Performance Reports
- 5. Queue Efficiency Report
- 6. Support/Cost Billing Reports
- 7. Request Resolution Reports
- 8. End User Satisfaction Reports
- 9. Purchasing and Asset Reports
- 10. License Compliance Reports
- 11. Project Request Review Reports
- 12. Workstation Reports
- 13. Listing Reports
- 14. Audit Trail Reports
- 15. ServicePRO Logins Report
- 16. ServicePRO Objects Report
- 17. Schedules
- 18. Custom Reports
- 18.1
- 18.2 Using Template
- 18.3 Base Report Tab
- 18.4 Filters Tab
- 18.5 Custom Fields Tab
- 18.6 Grouping Tab
- 18.7 Headers and Footers Tab
- 18.8 Layout/Preview Tab
- 18.9 Saving the Report
- 18.10 Emailing the Report
- 18.11 Running Reports
- 18.12 Custom Listing Reports
- 18.13 Custom Asset Reports
- 18.14 Examples of Custom Reports
- 18.15 Blank Reports
ServicePRO provides several standard reports so you can view and analyze your Service Desk performance. You can also create custom reports specific to your business requirements.
- ServicePRO uses Stimulsoft to generate all of its reports.
- Standard reports and custom reports are accessed from the Analytics menu item.
Navigation
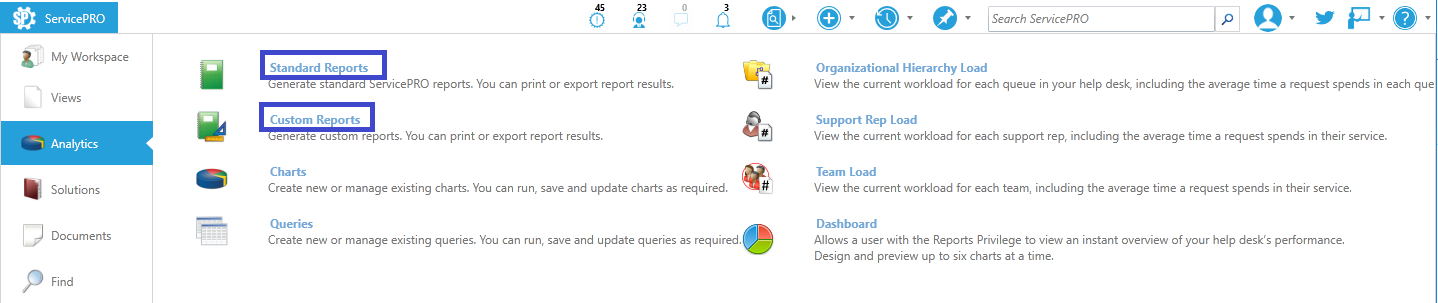
- Navigate to the backstage menu by clicking on the ServicePRO icon.
- Click on the Analytics option as highlighted below.
 Analytics Navigation
Standard Reports
- To open a list of standard reports, from the Analytics option, click on the Standard Reports icon. The Reports window opens as shown in the figure below.
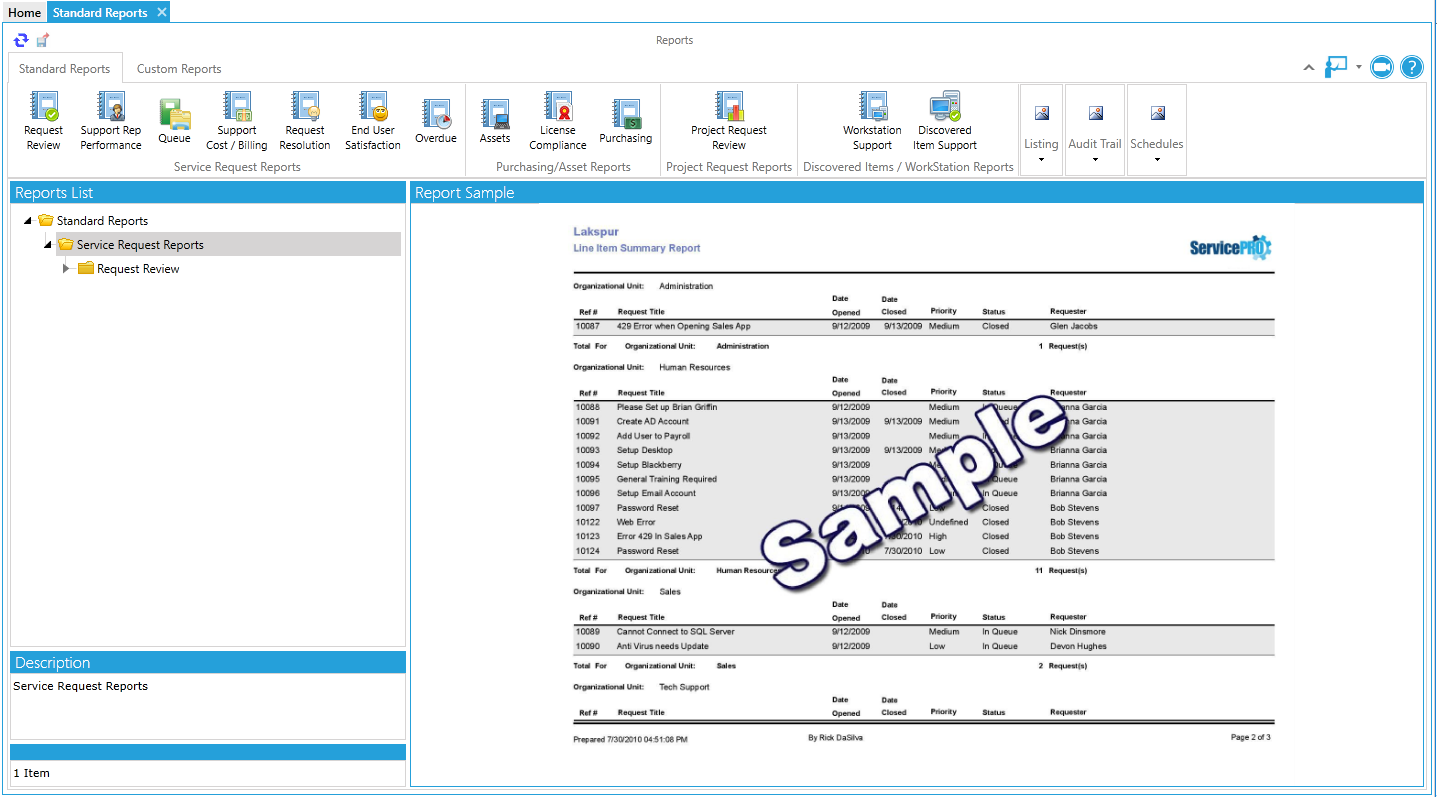 The Reports Window Showing a Sample Report
 - The window includes a Standard Reports toolbar, a Report List work area, and a Report Sample display area.
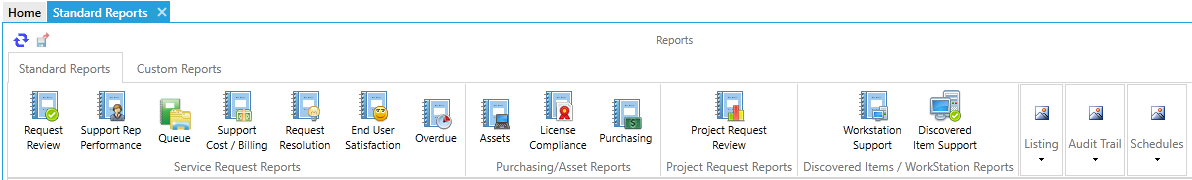
The Standard Reports toolbar, shown in the figure below, provides access to each report type included in ServicePRO and is split into the following six groups:
- Service Request Reports - View and generate reports related to service requests.
- Purchasing/Asset Reports - View and generate reports related to purchasing and assets.
- Project Request Reports - View and generate reports related to all project requests.
- Discovered Items/Workstation Reports - View and generate reports for workstations that are audited by windows service or discovered under discovered items.
- Listing - View a listing of ServicePRO objects.
- Audit Trail Task - View and generate reports related to user’s login attempts and changes made to ServicePRO objects.
- Schedules - View and generate reports related to schedules such as rules, reports, charts and query.
To generate any report, complete the following process:
- Click on an icon in the Standard Reports toolbar to view reports available in that category.
- Expand the folders in the Reports List to view the reports in each category. The available reports in each category will be discussed below.
- To run a report, highlight the name of the report. A sample report appears in the Report Sample display area.
- The Description area briefly describes the report.
- In the Date Range work area, select the date range for the report using one of the following methods:
• Select a predefined range from the drop-down list
• Select your own date range from the date drop-down lists - Click on the Preview Report button in the Date Range work area to generate the report.
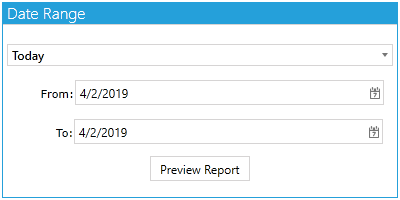 Date Range
Request Review Reports
This section allows you to generate reports related to service requests with varying degrees of detail as described below.The Grouping options available for Request Review Reports are shown below:
| Report Groups | Description |
|---|---|
| Status and Priority | Grouped by Status and Priority Scheduled/Suspended requests grouped separately |
| Company | Grouped by Company of the Requester |
| Organizational Unit | Grouped by Organizational Unit of the Requester |
| Support Rep | Grouped by designated Support Rep There will be no designated Support Rep until ownership has been set on a request (Assign Work) |
| Category | Grouped by Category associated with the request |
Line Item Summary Report
For each request opened in the chosen date range, the Line Item Summary Report displays requests listed in chronological order with limited information about the request.
Summary Report
For each request opened in the chosen date range, the Summary Report displays requests listed in chronological order with medium level of detail. It includes all the information available in the Line Item Summary Report plus additional request properties.
Detailed Work Report
For each request, the Detailed Work Report includes a summary of the request, and all related memos in chronological order. Please be advised that this option can create an extremely large report and should ideally be used for very short time frames.
Overview Report
For each request, the Overview Report includes only the totals for the related report for each grouping. So for example, if you want to see how many requests have been logged by each Department, you can use this report. You would need to select Organizational Unit as the grouping and the desired Date range as the filter. When you run the report you will see only the totals for the requests logged by each Organizational Unit – the report does not include any other details.
Support Rep Performance Reports
Timesheet
Timesheet Reports display and summarize all the request related activities of a support rep within a given time frame, with varying levels of detail.The Filter option available for Timesheet Reports is 'Date Worked'.
Detailed Timesheet Report
This report provides a complete outline of all work completed by a support rep because it includes all memos made in requests for a specified date range. Key features of this report are:
- The Report is grouped by Support Rep and Work Date and is based on individual ServicePRO memos entered.
- Each memo entry includes: ref #, request title, hours worked, requester, company/Organizational Unit, memo date/time, memo type, and memo text.
- For each work day the total number of requests and time worked for each support rep is displayed.
Summary Timesheet Report
This report provides a summary of work completed by the Support Reps. Key features of this report include:
- The Report is grouped by Support Rep and Work Date and is based on individual ServicePRO memos entered.
- Includes a one-line summary for each memo entry in the specified date range, with the following information: ref #, request title, requester, company/Organizational Unit, memo date/time, and hours worked.
- For each work day the total number of requests and time worked for each support rep is displayed.
- Key difference: memo information is not shown.
Overview Timesheet Report
This report provides an overview of the work completed by the Support Reps. Key features of this report include:- The Report is grouped by Support Rep and Work Date and is based on individual ServicePRO memos entered.
- Includes a daily overview for each support rep with the following information: Date Worked, total number of memos added, total number of requests updated, total time worked.
- Key difference: No request details shown.
Support Rep Efficiency Report
This report provides a one-line summary for each request closed during the reporting period grouped by Support Rep. Support Rep Efficiency Ratio is the average of Hours Worked/Hours In Service for all requests closed during the reporting period. The ratio is most meaningful when taken over periods exceeding one week. The closer this ratio is to one, the more efficiently the Help Desk is running. Key features of this report include:
- Information provided includes hours worked, days in service, and the request’s title.
- Factors that affect Support Rep efficiency statistics:
- Rep’s tendency to leave requests open overnight or over the weekend (thereby increasing the Days In Service). This is not indicative of the Rep’s efficiency.
- Rep’s tendency to work on several requests simultaneously (Hours In Service accumulates for all of them, while only one can be worked on at a given time). Reps should be encouraged (to the extent possible) to schedule requests that they are not currently working on using the Begin Work date field.
- Rep’s tendency to overstate the actual time worked on a request. Efficiency = Hours Worked/ Hours In Service.
- Days In Service does not include Days Suspended/Scheduled.
Queue Efficiency Report
The Queue Efficiency Report lists, by queue, all requests that were closed within a selected range. Resource constraints can be determined by comparing waiting times amongst queues. If some queues consistently exhibit higher than average waiting times, chances are that your operation should assign more Support Reps to these queues. Key features of this report include:
- Requests are grouped according to the last queue they were in (those that were never in a queue are omitted).
- For every request listed, you are shown: ref #, date opened, date closed, request title, priority, hours in dispatch, and days in queue.
- Average times by priority allow you to assess the effectiveness of your prioritization levels.
Support/Cost Billing Reports
The Billing Report is similar to the Detailed Work Report, but billing information is shown and full memo details are not. Some key features of this report include:
- For each request, this report includes a summary of the request, plus a one-line summary for each memo in chronological order, including the memo date/time, author, hours worked, and related charges.
- Available by company or by Organizational Unit.
- Helps you provide detailed summaries of time worked and the associated costs for your customers.
- Can assist the Service Desk manager to identify areas that over-utilize or under-utilize Service Desk resources.
- Can also be used in conjunction with your internal accounting system
- Billing reports consider memos and time worked in a request that were given a billable time code.
- A billing rate report is also available with summary information of cost and charge rates associated to each Support Rep.
- Note - Charge Rates should be set for the Support Reps
Request Resolution Reports
Summary First Call Resolution Report
This report shows the number and percentage of service requests that have been designated by Support Reps as being resolved on first contact.
The report includes the number and percentage of requests that were resolved on first contact by a suggested solution, which indicates the effect of best solutions on the first-call resolution rate.
The report is grouped by Support Rep, Category, Queue, Organizational Unit, and Company.
Detailed First Call Resolution Report
Two reports provide detailed looks at requests that have either been resolved or not resolved on first contact. The reports include a comprehensive summary of each service request, and all related memos in chronological order.
The report is grouped by Resolved on First Contact and Not Resolved on First Contact.
Summary Suggest Solutions Report
This report shows the number and percentage of closed requests that were resolved by suggested solutions, which indicates the effectiveness your knowledge base has regarding the resolution of requests.The report is grouped by Category, Support Rep, and Queue.
Not Resolved by Suggested Solutions Report
This report provides the details of all closed requests that were not resolved by suggested solutions. It includes a comprehensive summary of each service request, and all related memos in chronological order.
The report is grouped by Category, Support Rep, and Queue.
End User Satisfaction Reports
User Satisfaction Report
This report provides results of user satisfaction ratings registered by requesters (end users). Three user-satisfaction reports are available:- By Queue
- By Support Rep
- By Category
These reports break down (by count and by percentage) satisfaction levels with respect to both timeliness and quality of service. The reports include all requests closed in the specified date range.
Satisfaction by Queue and Satisfaction by Category Reports let you see how well your Service Desk is servicing particular request types. Satisfaction by Support Rep helps you see how each of your Support Reps is performing.
Overdue Report
This report is essentially a Detailed Work Report that includes only overdue requests. It presents a summary of the details of all overdue requests, grouped by requester, and includes all related memos in chronological order.Purchasing and Asset Reports
Purchasing Report
This report shows all products that have not been received or that have only been partially received within a specified date range. Products are grouped by vendor and within each vendor by purchase order number.Asset Reports
This group includes three kinds of Asset Reports: Asset Allocation, Asset Cost, and Asset Support.Asset Allocation Reports
This report set shows all assets acquired within a specific date range. This set includes five reports:
- All – Reports on all assets, including non-allocated assets; grouped by asset type.
- By Company – Reports on all assets allocated to companies. Assets reflected in this report are those allocated directly to the company, not for the users assigned to them.
- By Organizational Unit – Reports on all assets allocated to Organizational Units. Assets reflected in this report are those allocated directly to an Organizational Unit, not for the users assigned to them.
- By User – Reports on all assets allocated to users.
- By Asset – Reports on all assets allocated to other assets; such as a software asset allocated to a workstation asset.
Asset Cost Reports
These reports are available in summary and detail formats, as described below:
- Summary – Using different groupings, you can view a summary of the asset cost allocation for each company/Organizational Unit, or the overall expenditure by asset type.
- Detail – This report shows a detailed breakdown of the cost of assets acquired within a specific date range. The report is grouped by asset type:
- By Asset Type
- By Company – Shows the costs of assets allocated to companies. Assets reflected in this report are those allocated directly to the company, not the users assigned to them.
- By Organizational Unit – Shows the costs of assets allocated to Organizational Units. Assets reflected in this report are those allocated directly to the Organizational Unit, not the users assigned to them.
Asset Support Reports
These reports allow you to identify your organization’s most troublesome assets, or those that have incurred the highest support costs. The reports show all assets that have been associated with service requests via the Asset field. You can select from reports that rank assets in descending order by those having:
- The most associated requests.
- The most request hours worked.
- The highest costs (hourly rates x time worked) If your organization has defined asset types, you can run Asset Support Reports that group problem assets by asset type.
License Compliance Reports
Two reports let you compare the instances of installed software discovered by the Network Audit Service with the corresponding software assets in your ServicePRO database.- One report shows the license compliance for all software products.
- One report shows only the software products where there is a discrepancy between the number of owned and installed software products.
Project Request Review Reports
These reports provide information on the projects that you have running within ServicePRO. You can generate reports with two levels of detail on your projects:- Summary Report
- Detailed Report
The project summary report shows all the project types (starting with ad hoc projects (such as merging and child requests created on the fly) followed by the different templates used. For each project, the report shows the request number of the parent request on the project, the details of that parent request, how many child requests are underneath the parent, and how much time had been worked on the related request and all the children combined. This way you can see exactly how much time has been spent on each project.
The detailed report provides the same information, but – as its name implies – with more detail. The detailed report also shows a breakdown of every single request related to the project. Essentially, it provides details on the amount of time spent on each completed task within each project.
Workstation Reports
Workstation Support Report
This report helps you view the support that was spent on workstation assets belonging to your organization. You can select from the asset support grouping:- By Request Count
- By Total Time Worked
- By Support Cost
Discovered Item Support Report
This report helps you view the support that was spent on discovered items belonging to your organization. These are items that have been discovered during a network scan but have not been associated with an asset. You can select from the discovered item support grouping:- By Request Count
- By Total Time Worked
Listing Reports
These reports do not require any date selection and generate immediately when you select them. They list all objects in ServicePRO:- Company Listing – Includes all company details including users of the company.
- Organizational Unit Listing – Includes a list of users in within each Organizational Unit.
- User Listing – Includes all user details.
- Support Rep Listing – Includes Support Reps assigned.
- Queue Listing – Includes queue assignments.
- Category Listing – Includes category only.
- Workstation Listing – Includes all workstations.
- Best Solutions Listing – Includes all best solutions stored in the database.
- Assets Listing – Includes asset of all types.
- Team Listing – Includes all teams and the users within them.
- Password Reset Enrolled Users
- Password Reset Locked Out Users
- Discovered Items Listing Report – This report will fetch the details of all the Discovered Hardware Items (i.e. Workstations & Devices of all types).
- Discovered Items Support Report – This report details Discovered Items which are associated to Service Requests. Two reports are available in this group:
- Discovered Item Support – By Request Count
- Discovered Item Support – By Total Time Worked
Audit Trail Reports
Two different types of audit trail reports help you determine login activity and object change activity within ServicePRO.ServicePRO Logins Report
Clicking on this icon produces a report for the login and logout activity (including failed attempts) made over a specified time period. You can specify “All Dates” or define more specific date ranges to report on the login and logout activity. The report shows you:- Who logged in/out
- When the login/logout activity occurred
- Where the login/logout event occurred
- What version of ServicePRO was used during the login/logout event
If a login/logout attempt failed, you would see all the same information described above along with the addition that it was a failed attempt and whether the attempt was made using the ServicePRO client or web portal.
ServicePRO Objects Report
This report helps you track changes and additions to the different objects used within ServicePRO including:- Service Requests
- Purchase Requests
- Rules
- Project Templates
- Custom Forms
- System Email Accounts
- Best Solutions
- Users
- Companies
- Organizational Units
- Queues
- Categories
- Assets
- Products
- Roles
- Teams
For example, you can create reports to show activities on requests that were deleted, and who deleted the request. Using another example, you can create a report on Custom Forms to see:
- What actions were taken on custom forms
- When the action was taken
- What happened to the object
- Who took the action on the object
Schedules
Reports are generated with the details related to the scheduling of rules, custom reports, charts and queries that have an automatic schedule configured in ServicePRO.Custom Reports
The Custom Report Designer allows you to modify the standard report templates with your own selection criteria (filters), additional groupings and report fields.To create a new custom report, navigate to 'Custom Reports' from Analytics menu and select from one of the following options under “New”:
- Using Template – Design a new custom report from a pre-defined template.
- Blank Report – Create a new Custom Report from scratch instead of using a predefined template. For more details, please view the section on Blank Reports.
Using Template
If this option is selected then the following tabs will appear in the Designer Work Area.Base Report Tab
Select a pre-defined report template. (Review Standard Report section to learn about each report template)Once a template has been selected you can choose from the following design options for request selection:
- New Design – This pulls up a new query designer page and you can enter all the criteria for request selection.
- My Queries – Displays the queries that you have created and marked as private. Select an existing query to generate a ServicePRO report.
- Public Queries – Displays all queries created by all users and marked as public. Select a public query to generate a ServicePRO report.
- My Reports – Displays all custom reports that you have created and marked as private.
- Public Reports – Displays all custom reports created by any user and marked as public.
For asset reports, you also can use the following features:
- New Search – Create a new custom report based on search criteria.
- Open Searches – List your private and public saved searches based on a specific object.
- My Reports – List private reports based on a specific object.
- Public Reports – List public reports based on a specific object.
Filters Tab
The filters tab displays the fields that can be used for filtering the requests that should appear in the final report. If New Design was selected in the previous step then a blank field selection work area will appear. If an existing query had been selected in the previous step then those query conditions will appear in this tab.New Design Field Selection and Criteria:
- From the Filters tab, select the fields that you want to use as filters in the report by clicking on the corresponding checkbox. In the example shown below, the Time Logged and Assigned Priority fields have been selected.
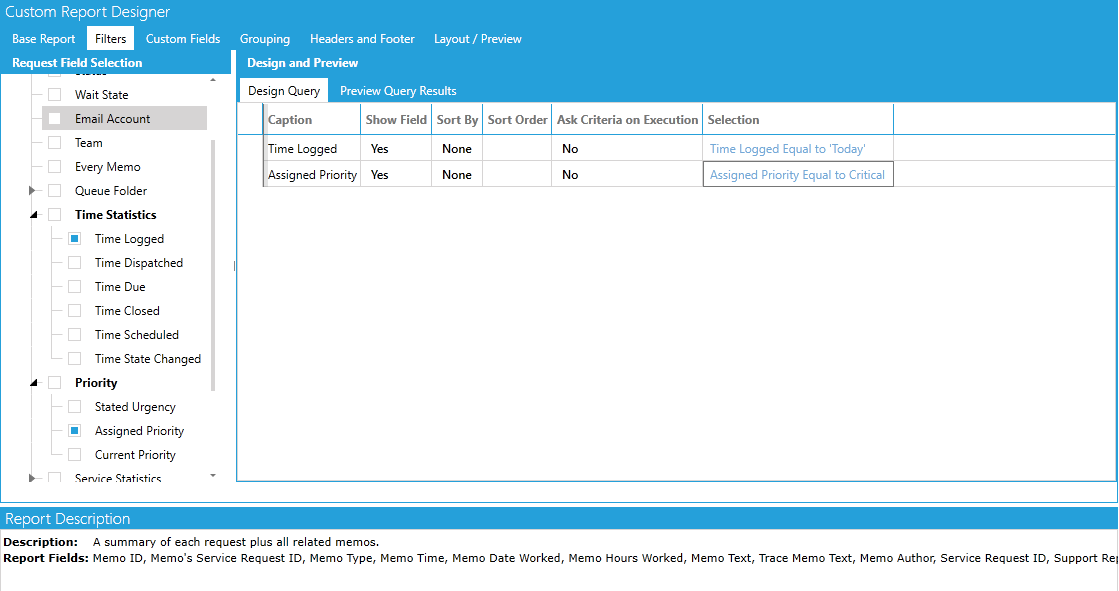
- Click in the Criteria cell in the Selection column for a field to enter selection criteria for the data that will appear in the report. A window like that shown in the figure below opens.
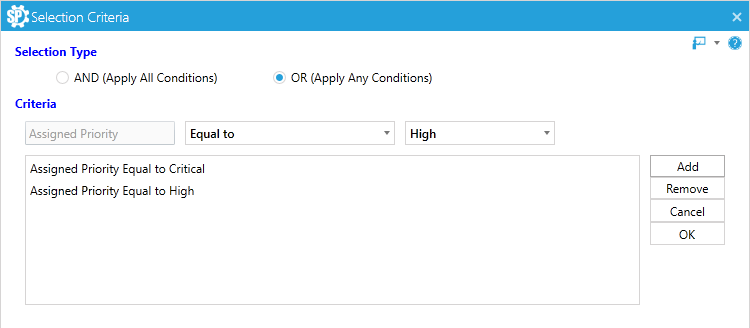
- Click on the And or Or radio button in the Selection Type work area to define the operator you want to use to combine your search strings. In the example above, the search will find requests with an assigned priority of “Critical” or “High.”
- The first Criteria field lists the field you are using in the query.
- From the next drop-down list, select “Equal to” or “Not Equal to” to indicate that the contents of the field should be equal to or not equal to the selected value. For fields such as text or numbers, the parameters presented in this list may vary depending on the criteria type.
- From the final drop-down list, select the value you are searching for.
- Click on the Add button.
- Highlight a condition and click on the Remove button if you decide not to include it.
- Click on the OK button to save the criteria.
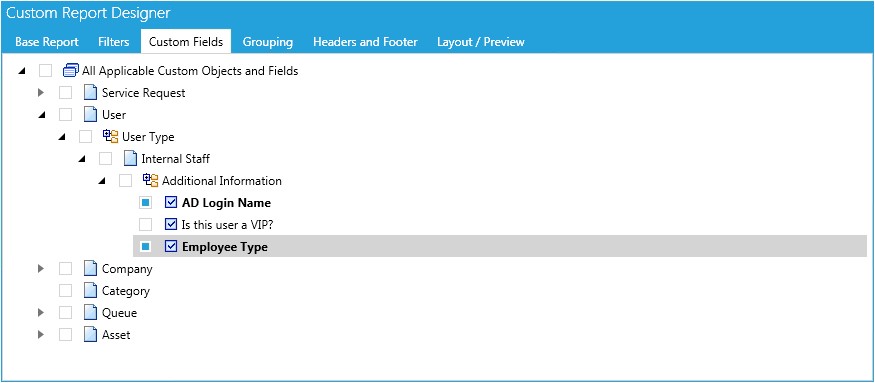
Custom Fields Tab
This tab will display available Custom fields that can be added to the Standard Report Template you are customizing.To add your Custom Fields, expand down to the desired field for your report. Check any fields that you wish to pull to your report that were created via ServicePRO’s Form Designer.
Once selected, you can access these fields on the Layout/Preview tab of your report.
Grouping Tab
The Grouping tab helps you modify the grouping and sort order of the report by selecting from the Available Groups list.- To add an item, highlight it in the Available Groups list then click on the Add button. You can also drag an item directly to the Selected Groups list. You can add up to 3 groupings per report.
- To change the order of the selected groups, highlight the one you want to move and click on the Move Up or Move Down button (as shown in the figure below).
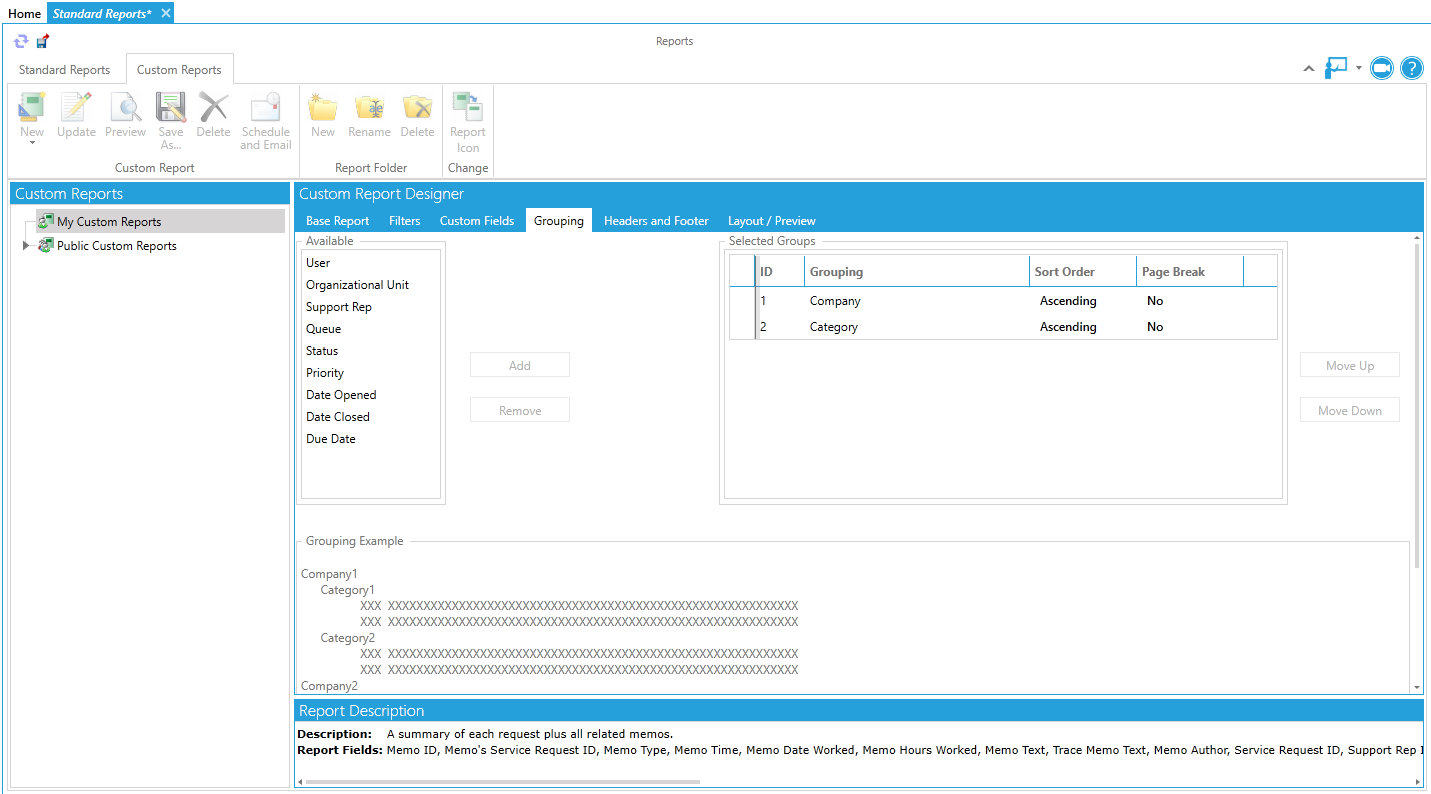 Grouping Tab
 - To change the data sort order for a group, click in the group’s cell in the Sort Order column and change the value to “Ascending” or “Descending” as needed.
- Click in the group’s cell in the Page Break column to insert a page break in the report after each group.
- The Grouping Example work area shows you how the report will be grouped.
Headers and Footers Tab
The Headers and Footer tab, shown in the figure below, helps you edit the text displayed in your report’s headers and footer. You can also specify whether you want to display page numbers and the preparation date.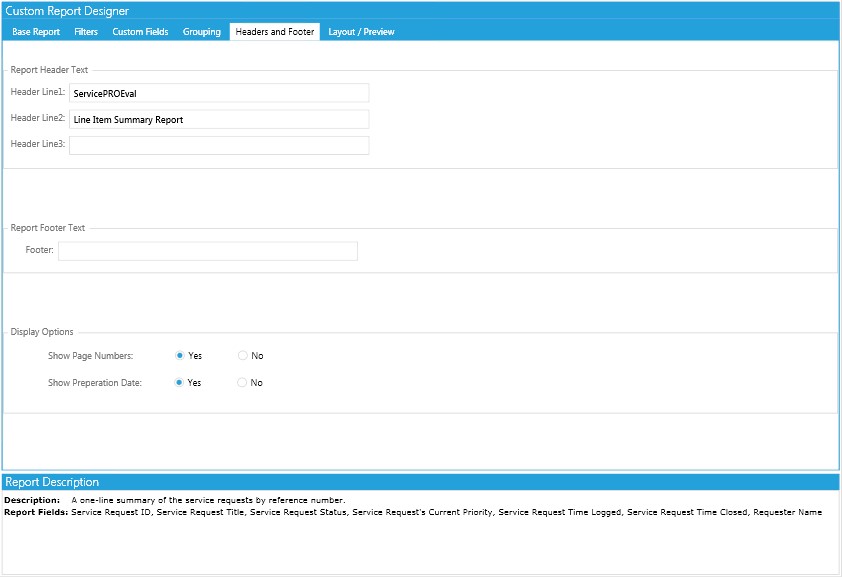
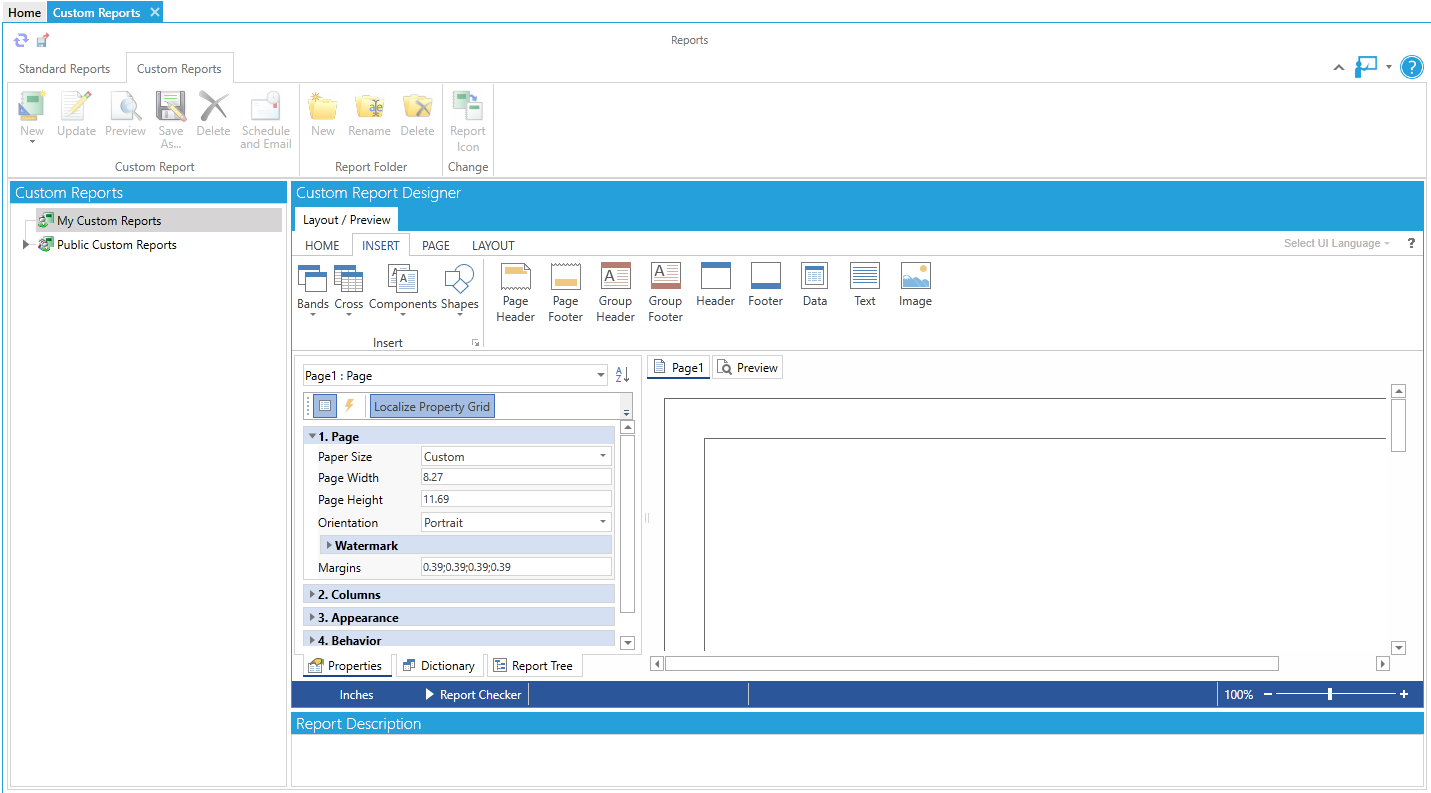
Layout/Preview Tab
The Layout/Preview tab, shown in the figure below, helps you edit the layout and design of your report. Click on the Preview button to view the report.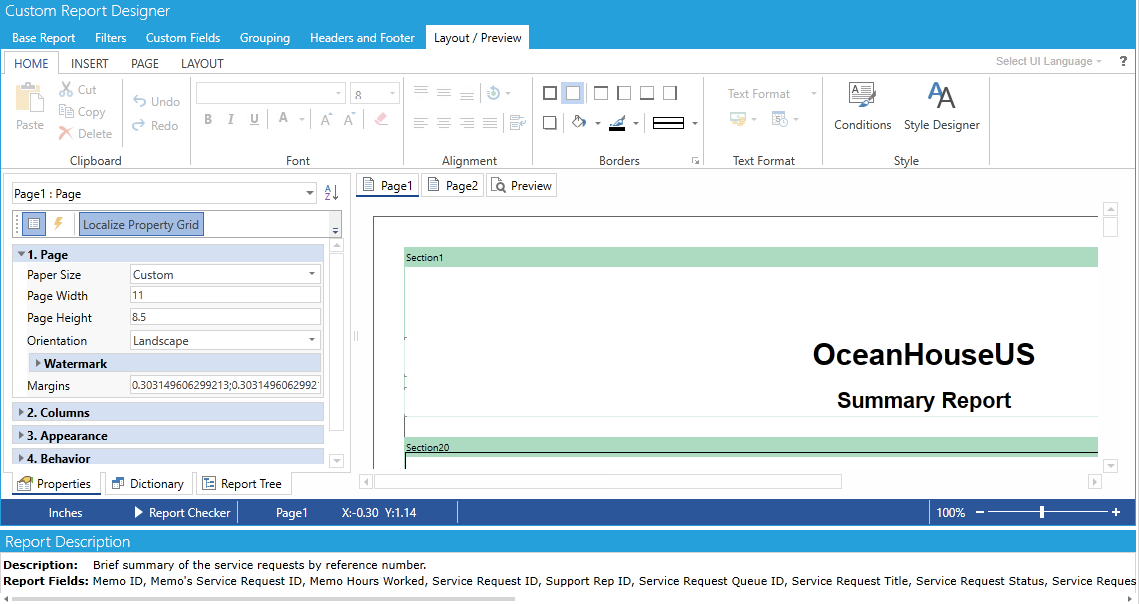
In the Layout/Preview tab, the Stimulsoft Silverlight Report Designer component will be loaded with the Report Dictionary prepopulated with SQL connection to ServicePRO Database as Data Source in order to make it readily available for the user to use.
SQL Connection Strings will be formed based on Authentication configured for ServicePRO; this can be retrieved from DataConfiguration.Config (SQL or NT).
The user will not be allowed to edit the pre-populated Data Connection, or create a new one. The option to create a New Connection will be disabled.
Page 1 tab will allow you to edit the Title/Cover Page of the report, such as updating the company logo.
Page 2 tab will allow you to remove current report fields, add additional fields to the report using the Report Dictionary and compute totals, averages etc. if required.
Preview tab will allow you to test any changes to the report and preview the final result.
Saving the Report
- When you have entered all of the report parameters, click on the Save icon in the Quick Access Toolbar to save the report.
- Enter a name for the report.
- Click on the Public checkbox to allow users other than yourself to run this report.
Emailing the Report
- After you save your report, the Schedule and Email icon becomes available so you can configure the system to automatically generate and send emails to specified recipients each time the report is run.
- Click on the Schedule and Email icon to open the Schedule and Email Reports dialog as shown below.
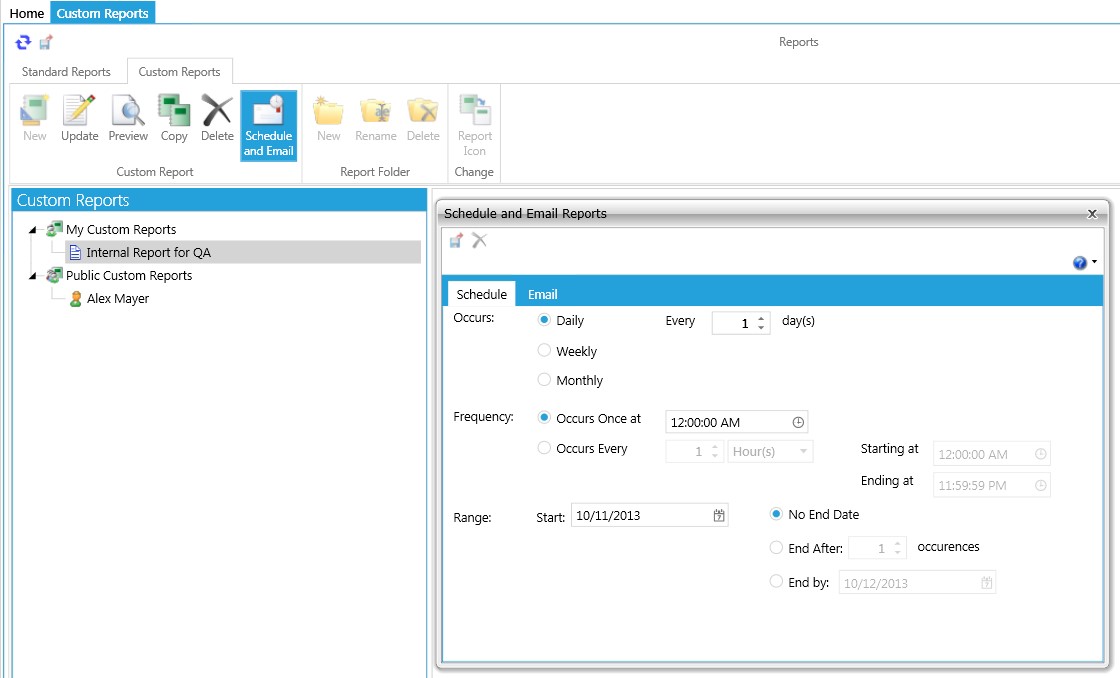
- From the Schedule tab, define how often you want to run the report and the date range the report should cover.
- From the Email tab, click on New to open the Email Template dialog. From there, you can create a new template that includes the names of the recipients and a supporting message, or you can choose from an existing email template.
- Click on the Save and Exit icon to save the email template.
- Click on the Save and Exit icon to save the new schedule for the custom report.
The report will now be generated at the schedule interval specified and emailed to the recipients on the notification template.
If a report does not contain any records at time of being generated for emailing, by default, only the original creator of that report will receive notification email(s) stating that there are no records.
If the creator does not wish to receive the email, an option to switch the no records notifications to be sent to all the notification email recipients instead. Please contact ServicePRO Technical Support for more information and assistance in enabling this feature.
Running Reports
- From the Custom Report Designer, locate the report that you want to run. They will be found in either the My Reports folder (contains reports you previously created) or the Public Reports folder (contains reports created by other users that are available to all users).
- Highlight the report and choose one of the following actions:
Update – Update the report by changing the query conditions, groupings and report design.
Save As – Create a copy of the report under a different name.
Delete – Delete the report completely.
Schedule and Email – Discussed in the section title ‘Emailing the Report’.
Custom Listing Reports
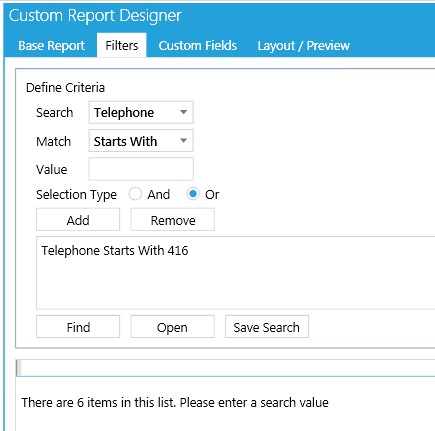
Custom Listing reports are generated in a similar manner to request reports. They allow you to:- Report on other objects in ServicePRO (such as company, Organizational Unit, user, and so on).
- Use an advanced search window to filter on these objects, as shown in the figure below. Other features (grouping and sorting, and more) are exactly the same as in the request reports.
Custom Asset Reports
Custom Asset reports are similar to Listing Reports. Custom Asset reports are based on the results of advanced search criteria with one exception: the Custom Asset Support Report can also be based on the equivalent template used in standard reports (that is, based on a query).Examples of Custom Reports
Please refer to Sample Custom Reports.
Blank Reports
Users can create and edit Custom Reports from scratch using a blank report template. These blank templates use a SQL Connection to the ServicePRO Database as a data source, allowing for free and flexible report creation from within ServicePRO.
Users can initiate Blank Template report creation under Custom Reports; the existing “New” option in the ribbon toolbar now offers two options for Custom Report creation:
- Blank Report – Creation of new Custom Report functionality from scratch, with no templates
- Using Template – Creation of Custom Reports using base templates as discussed above
When creating Custom Reports from a blank template in the Custom Report Designer, the following typical reporting tabs will not be loaded:
- Base Report
- Filters
- Custom Fields
- Grouping
- Header and Footer
Chart Component
Charts can be added when designing Custom Reports using Blank Template therefore it’s possible to generate charts in the application with the custom filtered and grouped data.
Blank Report Creation
Under the Layout/Preview tab, the Stimulsoft Silverlight Report Designer component will be loaded with the Report Dictionary, prepopulated with SQL connection to ServicePRO Database as Data Source.
Screenshots below outline the steps involved in creating a Blank Report using an SQL Query:
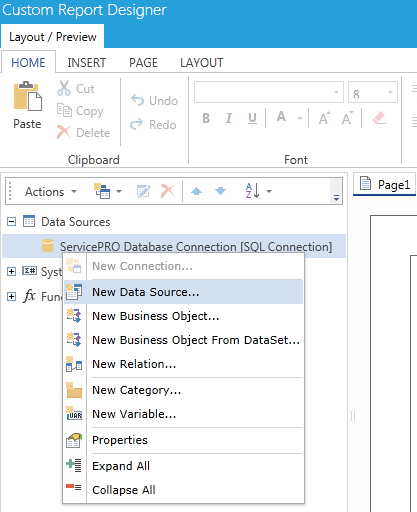
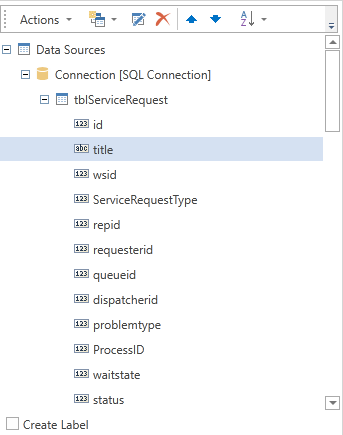
1. From the left pane, expand Data Sources and right click on ServicePRO Database Connection. Select ‘New Data Source’. In the window that appears the user will need to write an SQL query for creating the Report Data Source.
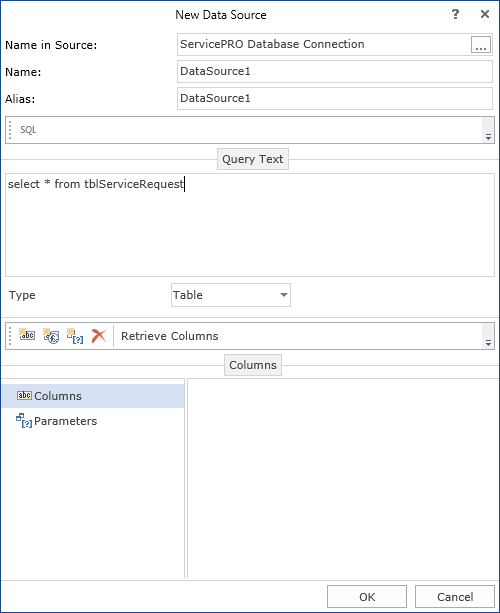
2. Keep the Type selected as Table and click on ‘Retrieve Columns’. The Report Dictionary will be populated with fields from the executed SQL query. Select OK.
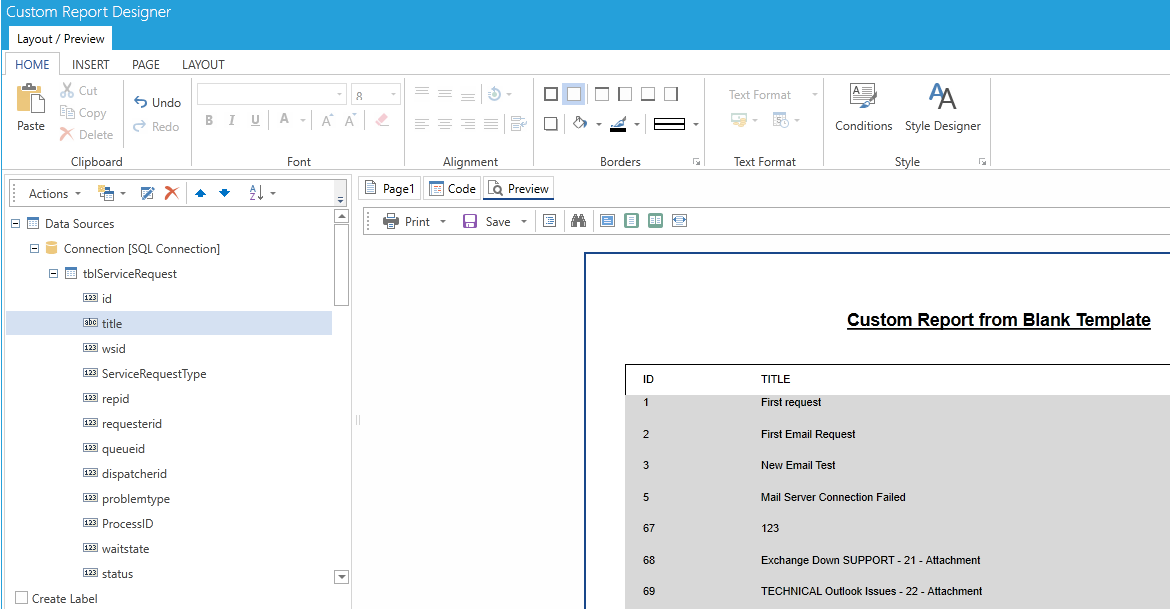
3.The user can begin designing the report. From the Insert Tab first select the appropriate bands (Page Header/Footer, Group Header/Footer, Data) and add to the report designer. The user can then choose fields from the report dictionary for placing in the report designer.
4. The user can preview the report to verify if the SQL query validates correctly, and ensure the designed report works as intended.
5. Save the report.
User Restrictions
As users will be writing their own SQL queries to retrieve data, there is no way to restrict access to requests using RBAC as is normally the case for the templated reports.
A user that is running/creating the report can view all requests regardless of whether they have permission on the queue folder the request resides in. Therefore, users creating reports should be careful which requests are displayed in the reports and who has access to view these reports.
Report Records Limit
System Options settings for the maximum allowed report records will be created and used in the same manner as reports created from a base template. When a report is rendered:
- The record count of each Data Source in the dictionary will be retrieved from the database, regardless of whether the data source is used in the report design or not. This count will contribute to the total record count for the report.
- The total record count is then compared with the number set in System Options to check if it exceeds that number.
- If this value is exceeded, a message will be displayed to the user. The same method will be used to check if the report has no records.
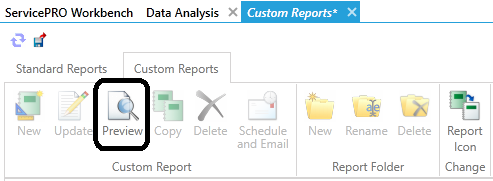
Previewing Custom Reports Created from a Blank Template
Previewing a Custom Report created from a blank template is functionally similar to previewing reports created from a base report. Users should select the report from the custom reports tree, then select the “Preview” button in the ribbon toolbar. The report will be generated and the preview will be rendered in a new tab using the Stimulsoft Report viewer.
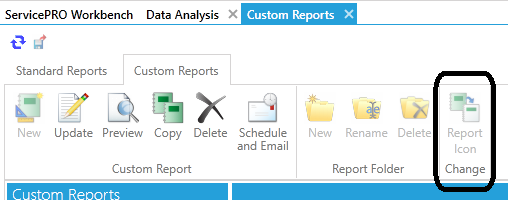
Change Report Icon
The ‘Change Report Icon’ ribbon menu option will be disabled for Custom Reports created from Blank Templates, as these reports have no default icon attributed to them for editing.
Limitation
Stimulsoft Charts will continue to work as intended with the custom reports created using ServicePRO pre-defined Report templates. However, the Charts component is currently unsupported for reports created using Blank templates.
Using Stored Procedures in Blank Reports
The following enhancement has been implemented with Custom Reports creation using Blank templates. While setting up Data Source for the report, ‘Stored Procedure’ type SQL Command is now facilitated. This will enable the designing of reports that involve complex querying and computations.Configure Data Source using Stored Procedure
- The report designer user needs to enter the name of the stored procedure under ‘Query text’ Section [Stored Procedure name starting with hssp_report].
- Select ‘Stored Procedure’ in the ‘Type’ drop down.
- And then, click on ‘Retrieve Columns’. The ‘Columns’ and ‘Parameters’ will be retrieved for the specified Stored Procedure.
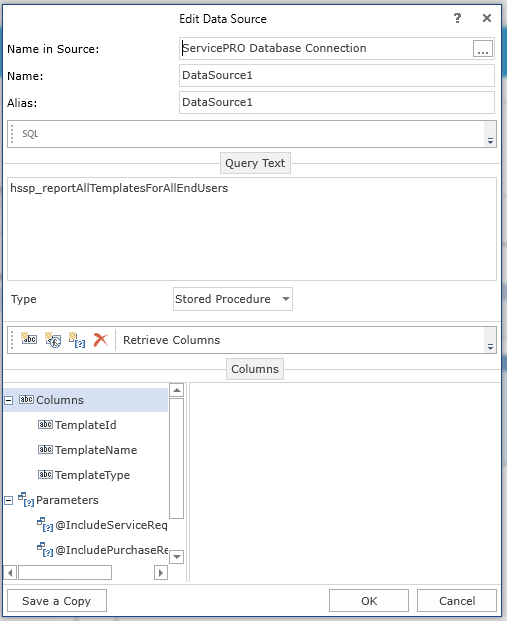 Figure 1 – Creating Datasource using Stored Procedure
 - As shown in Figure 2 and Figure 3, Parameter values can be inputted for the stored procedure.
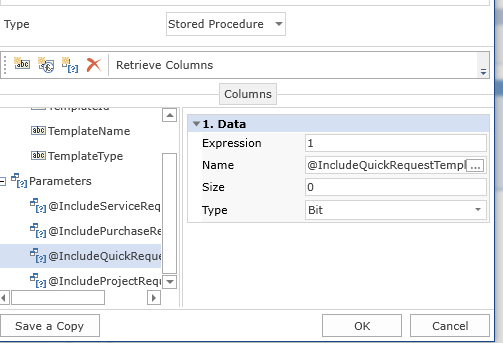 Figure 2 – Entering value for the Bit type parameter in ‘Expression’ field
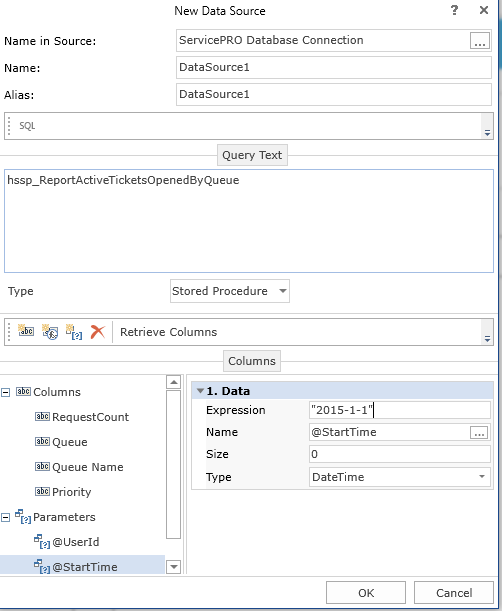 Figure 3 – Entering value for the DateTime type parameter in ‘Expression’ field
 - After entering parameters, when clicked OK, the Datasource will be successfully added into the Report Dictionary.
- At this stage, the Report Dictionary can be saved for later use [eg: For use in another report that would require the same Data Source using the same Database Connection.] – by using the option ‘Save Dictionary As…’ under ‘Actions’ menu in the ‘Dictionary’ tab. [Figure 4]. It will get saved in a file with .dct extension.
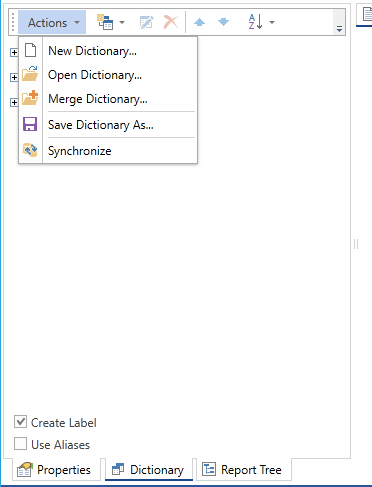 Figure 4 – Saving the Dictionary for creating the Datasource for another report
 - And then, Data Band can be inserted into the Report. And the Columns listed in the Data Source can be chosen to display in the Data Band.
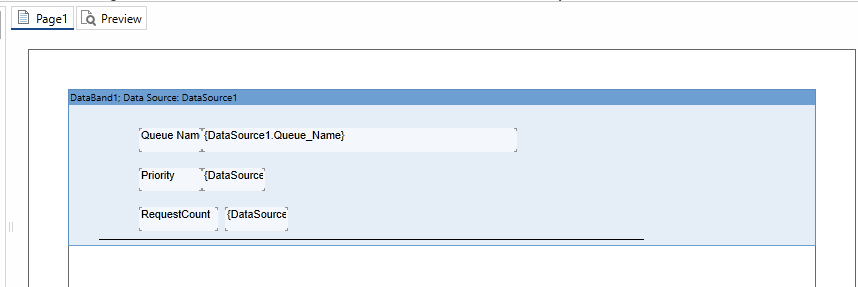 Figure 5 – Designing the report Data Band
 - And when clicked on ‘Preview’, the data will be fetched by executing the stored procedure based on the parameter values set in the data source. There will not be any prompting for setting parameter values during preview/run time.
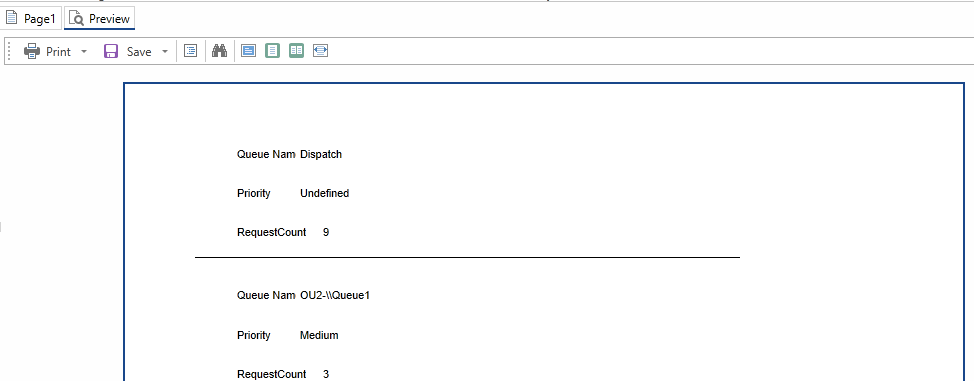 Figure 6 – Previewing the Report
 - At this stage, the Report Design / Page can be saved for later use [eg. For use in another report that would require the same Data Source using the same Database Connection.] by using the ‘Save Page As…’ context menu option in the ‘Page’ tab. [Figure 7]. It will get saved in a file with .pg extension.
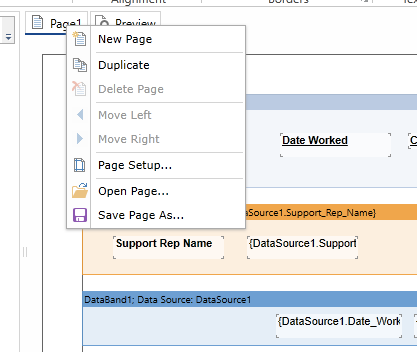 Figure 7 – Saving the Page for creating the Design for another report using the same Datasource
Create a Blank Report by importing stored dictionary and page files
- Start creating a Custom Report by selecting ‘New -> Blank Report’ option under Custom Reports.
- In the ‘Layout/Preview’ tab in Custom Report Designer, under ‘Dictionary’ tab, use ‘Actions -> Open Dictionary’ menu to select/open the dictionary (.dct file) to import for creating the Datasource. Ensure that the dictionary that is selected was created using the same database connection as the current one. [Figure 8]
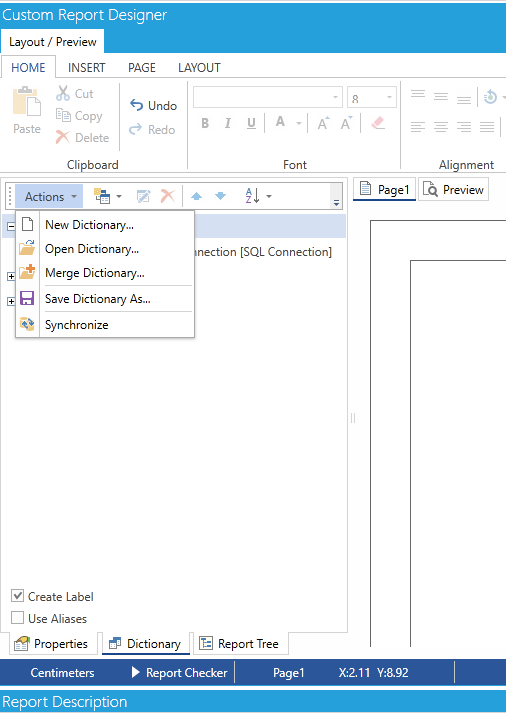 Figure 8 – Open the saved dictionary for creating the Datasource
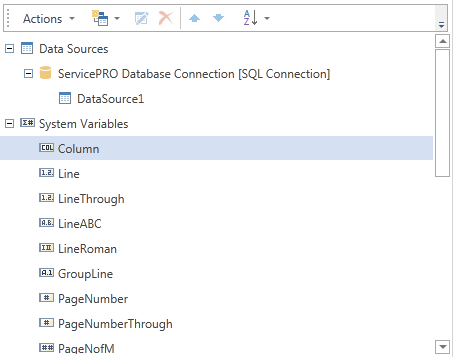
 - Now if you expand the Database connection under ‘Data Sources’, you will see a new Data Source ‘DataSource1’ added. [Figure 9]
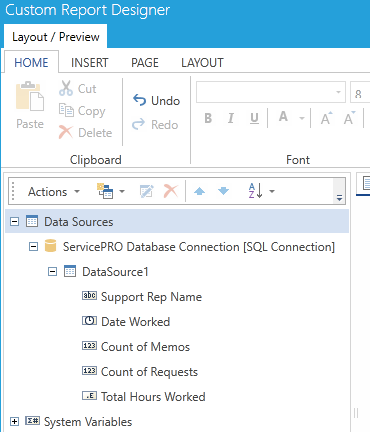 Figure 9 – Data Source created from importing the saved dictionary
 - Now, right click on the ‘Page’ tab shown inside the designer and click on ‘Open Page’ menu option to select/open the saved page file (.pg file) to import for creating the page design for the report. [Figure 10, Figure 11]
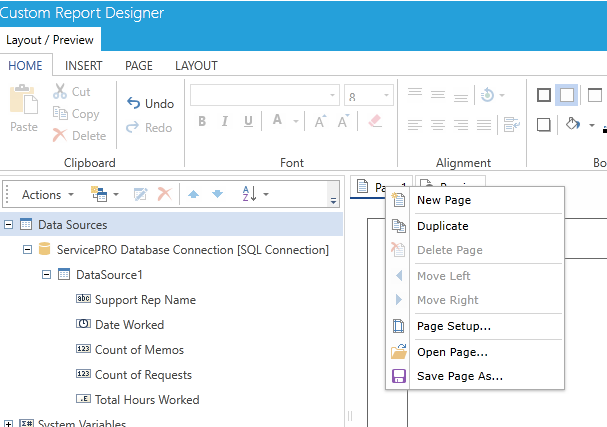 Figure 10 – Open the saved page for importing the report’s page design
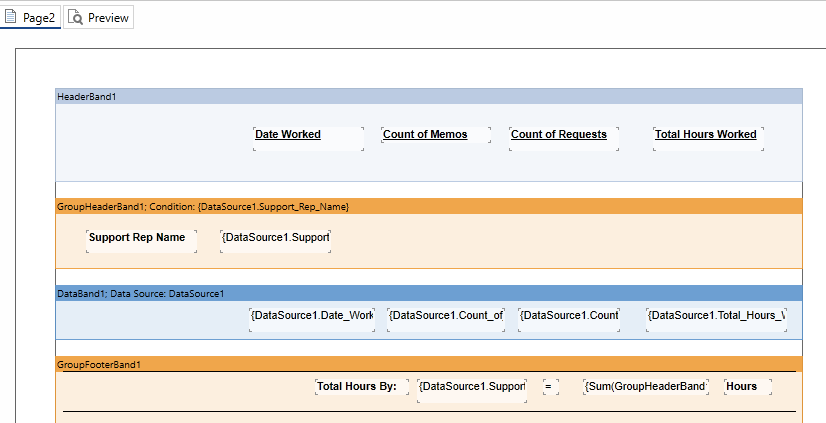 Figure 11 – Report Page design created from importing the saved page file
Return to Data Analysis